> ## Documentation Index
> Fetch the complete documentation index at: https://docs.langtrace.ai/llms.txt
> Use this file to discover all available pages before exploring further.
# Grafana Cloud
> Langtrace and Grafana Integration Guide
## Overview
Grafana Cloud is a fully managed observability stack that includes Grafana, Loki, Tempo, and Prometheus. This guide focuses on integrating Langtrace AI with Grafana Cloud for distributed tracing using Tempo. Grafana Cloud allows you to leverage its powerful capabilities to analyze and visualize trace data from Langtrace AI.
 ## Prerequisites
Before you begin, ensure you have the following:
* A [Grafana Cloud](https://grafana.com/) account
* A [Langtrace AI](http://langtrace.ai) account.
## Setup
### Generate Grafana API Token
To generate the Grafana API token, follow the steps in [this guide](https://grafana.com/docs/grafana-cloud/monitor-applications/application-observability/setup/quickstart/python/). The outcomes of this step are the values of
* `OTEL_EXPORTER_OTLP_ENDPOINT`
* `OTEL_EXPORTER_OTLP_HEADERS`
### Install the Instrumentation Library
If you haven't already, install the latest release of the OpenTelemetry Python package:
```bash theme={null}
pip install opentelemetry-distro[otlp]
opentelemetry-bootstrap -a install
```
### Environment Configuration
To configure your environment for Grafana Cloud, use the values from the Grafana API token steps to set the following environment variables:
```bash theme={null}
export OTEL_EXPORTER_OTLP_PROTOCOL="http/protobuf"
export OTEL_EXPORTER_OTLP_ENDPOINT=""
# Python requires "Basic%20" instead of "Basic "
export OTEL_EXPORTER_OTLP_HEADERS="Authorization=Basic%20"
export OTEL_RESOURCE_ATTRIBUTES="service.name=your-app-name,service.instance.id=your-app-instance"
```
For Python replace the space after Basic with %20
OTEL\_EXPORTER\_OTLP\_HEADERS=“Authorization=Basic%20lkawhklwhkh”
Replace the following values:
* `your_encoded_api_token` with your actual Grafana Cloud API token.
* `your_oltp_endpoint` with your endpoint values
* `your-app-name` with your application/service name
* `your-app-instance` with your instance name
### Install & Initialize Langtrace SDK
* Install Langtrace’s SDK and [**initialize**](https://docs.langtrace.ai/quickstart) the SDK in your code.
```bash theme={null}
# Install the SDK
pip install langtrace-python-sdk
# Import it into your project
from langtrace_python_sdk import langtrace # Must precede any llm module imports
langtrace.init(api_key = 'LANGTRACE_API_KEY')
```
* For sending traces to Grafana, you do not need a Langtrace API key.
* Run your application using the OpenTelemetry Python automatic instrumentation tool **`opentelemetry-instrument`**:
```bash theme={null}
opentelemetry-instrument python YOUR_APPLICATION.py
```
**Verification**
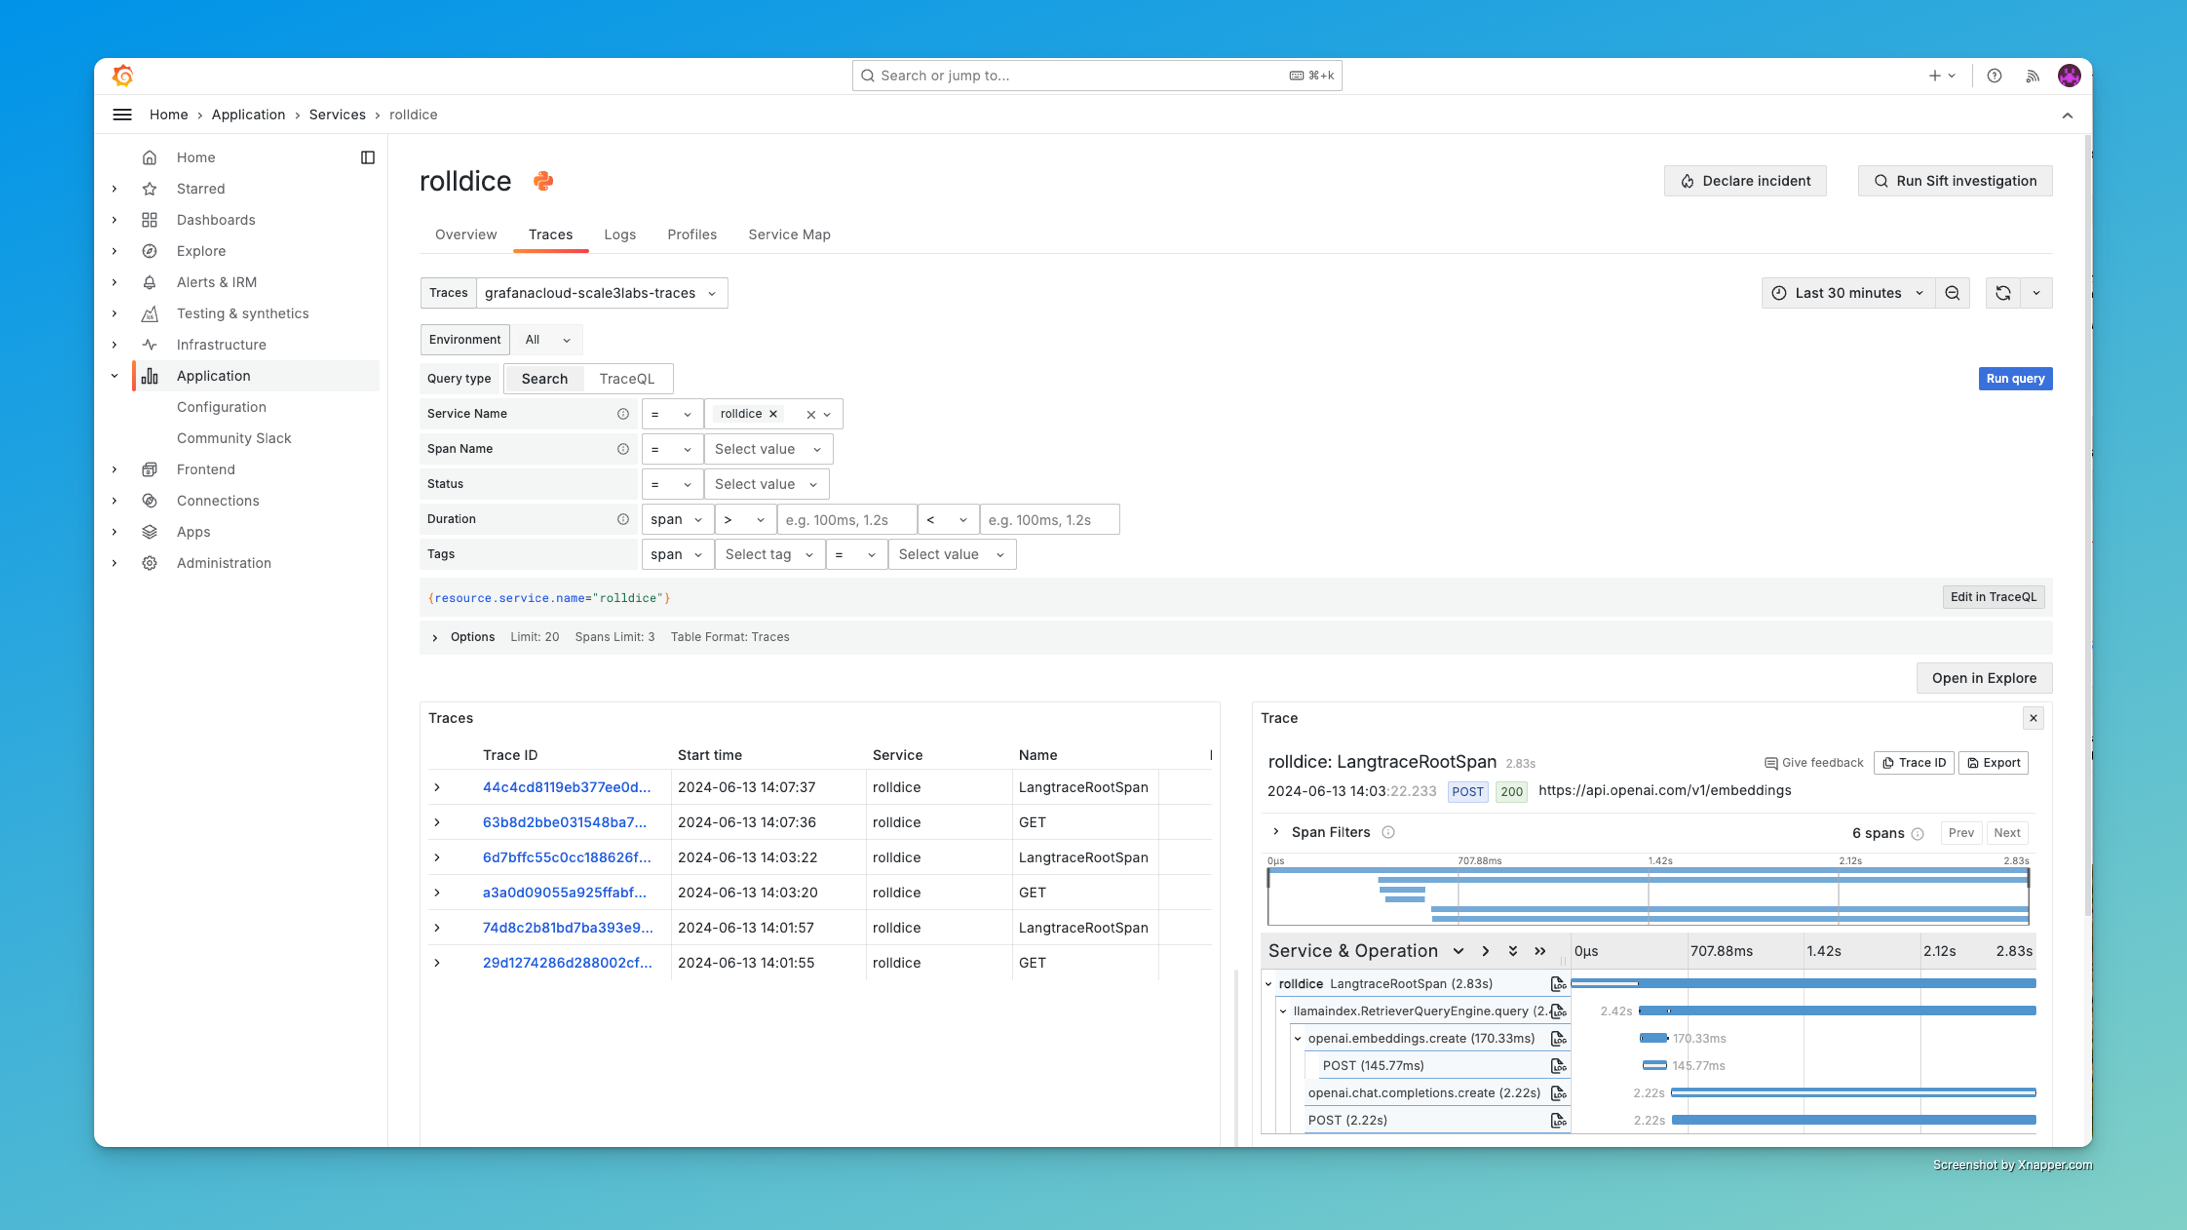
After running your Langtrace application, you should see traces generated in Grafana Tempo. You can now visualize and analyze the incoming requests and outgoing LLM calls made by your LLM application. Below is example of what you can expect to see in Grafana after integrating Langtrace:
## Prerequisites
Before you begin, ensure you have the following:
* A [Grafana Cloud](https://grafana.com/) account
* A [Langtrace AI](http://langtrace.ai) account.
## Setup
### Generate Grafana API Token
To generate the Grafana API token, follow the steps in [this guide](https://grafana.com/docs/grafana-cloud/monitor-applications/application-observability/setup/quickstart/python/). The outcomes of this step are the values of
* `OTEL_EXPORTER_OTLP_ENDPOINT`
* `OTEL_EXPORTER_OTLP_HEADERS`
### Install the Instrumentation Library
If you haven't already, install the latest release of the OpenTelemetry Python package:
```bash theme={null}
pip install opentelemetry-distro[otlp]
opentelemetry-bootstrap -a install
```
### Environment Configuration
To configure your environment for Grafana Cloud, use the values from the Grafana API token steps to set the following environment variables:
```bash theme={null}
export OTEL_EXPORTER_OTLP_PROTOCOL="http/protobuf"
export OTEL_EXPORTER_OTLP_ENDPOINT=""
# Python requires "Basic%20" instead of "Basic "
export OTEL_EXPORTER_OTLP_HEADERS="Authorization=Basic%20"
export OTEL_RESOURCE_ATTRIBUTES="service.name=your-app-name,service.instance.id=your-app-instance"
```
For Python replace the space after Basic with %20
OTEL\_EXPORTER\_OTLP\_HEADERS=“Authorization=Basic%20lkawhklwhkh”
Replace the following values:
* `your_encoded_api_token` with your actual Grafana Cloud API token.
* `your_oltp_endpoint` with your endpoint values
* `your-app-name` with your application/service name
* `your-app-instance` with your instance name
### Install & Initialize Langtrace SDK
* Install Langtrace’s SDK and [**initialize**](https://docs.langtrace.ai/quickstart) the SDK in your code.
```bash theme={null}
# Install the SDK
pip install langtrace-python-sdk
# Import it into your project
from langtrace_python_sdk import langtrace # Must precede any llm module imports
langtrace.init(api_key = 'LANGTRACE_API_KEY')
```
* For sending traces to Grafana, you do not need a Langtrace API key.
* Run your application using the OpenTelemetry Python automatic instrumentation tool **`opentelemetry-instrument`**:
```bash theme={null}
opentelemetry-instrument python YOUR_APPLICATION.py
```
**Verification**
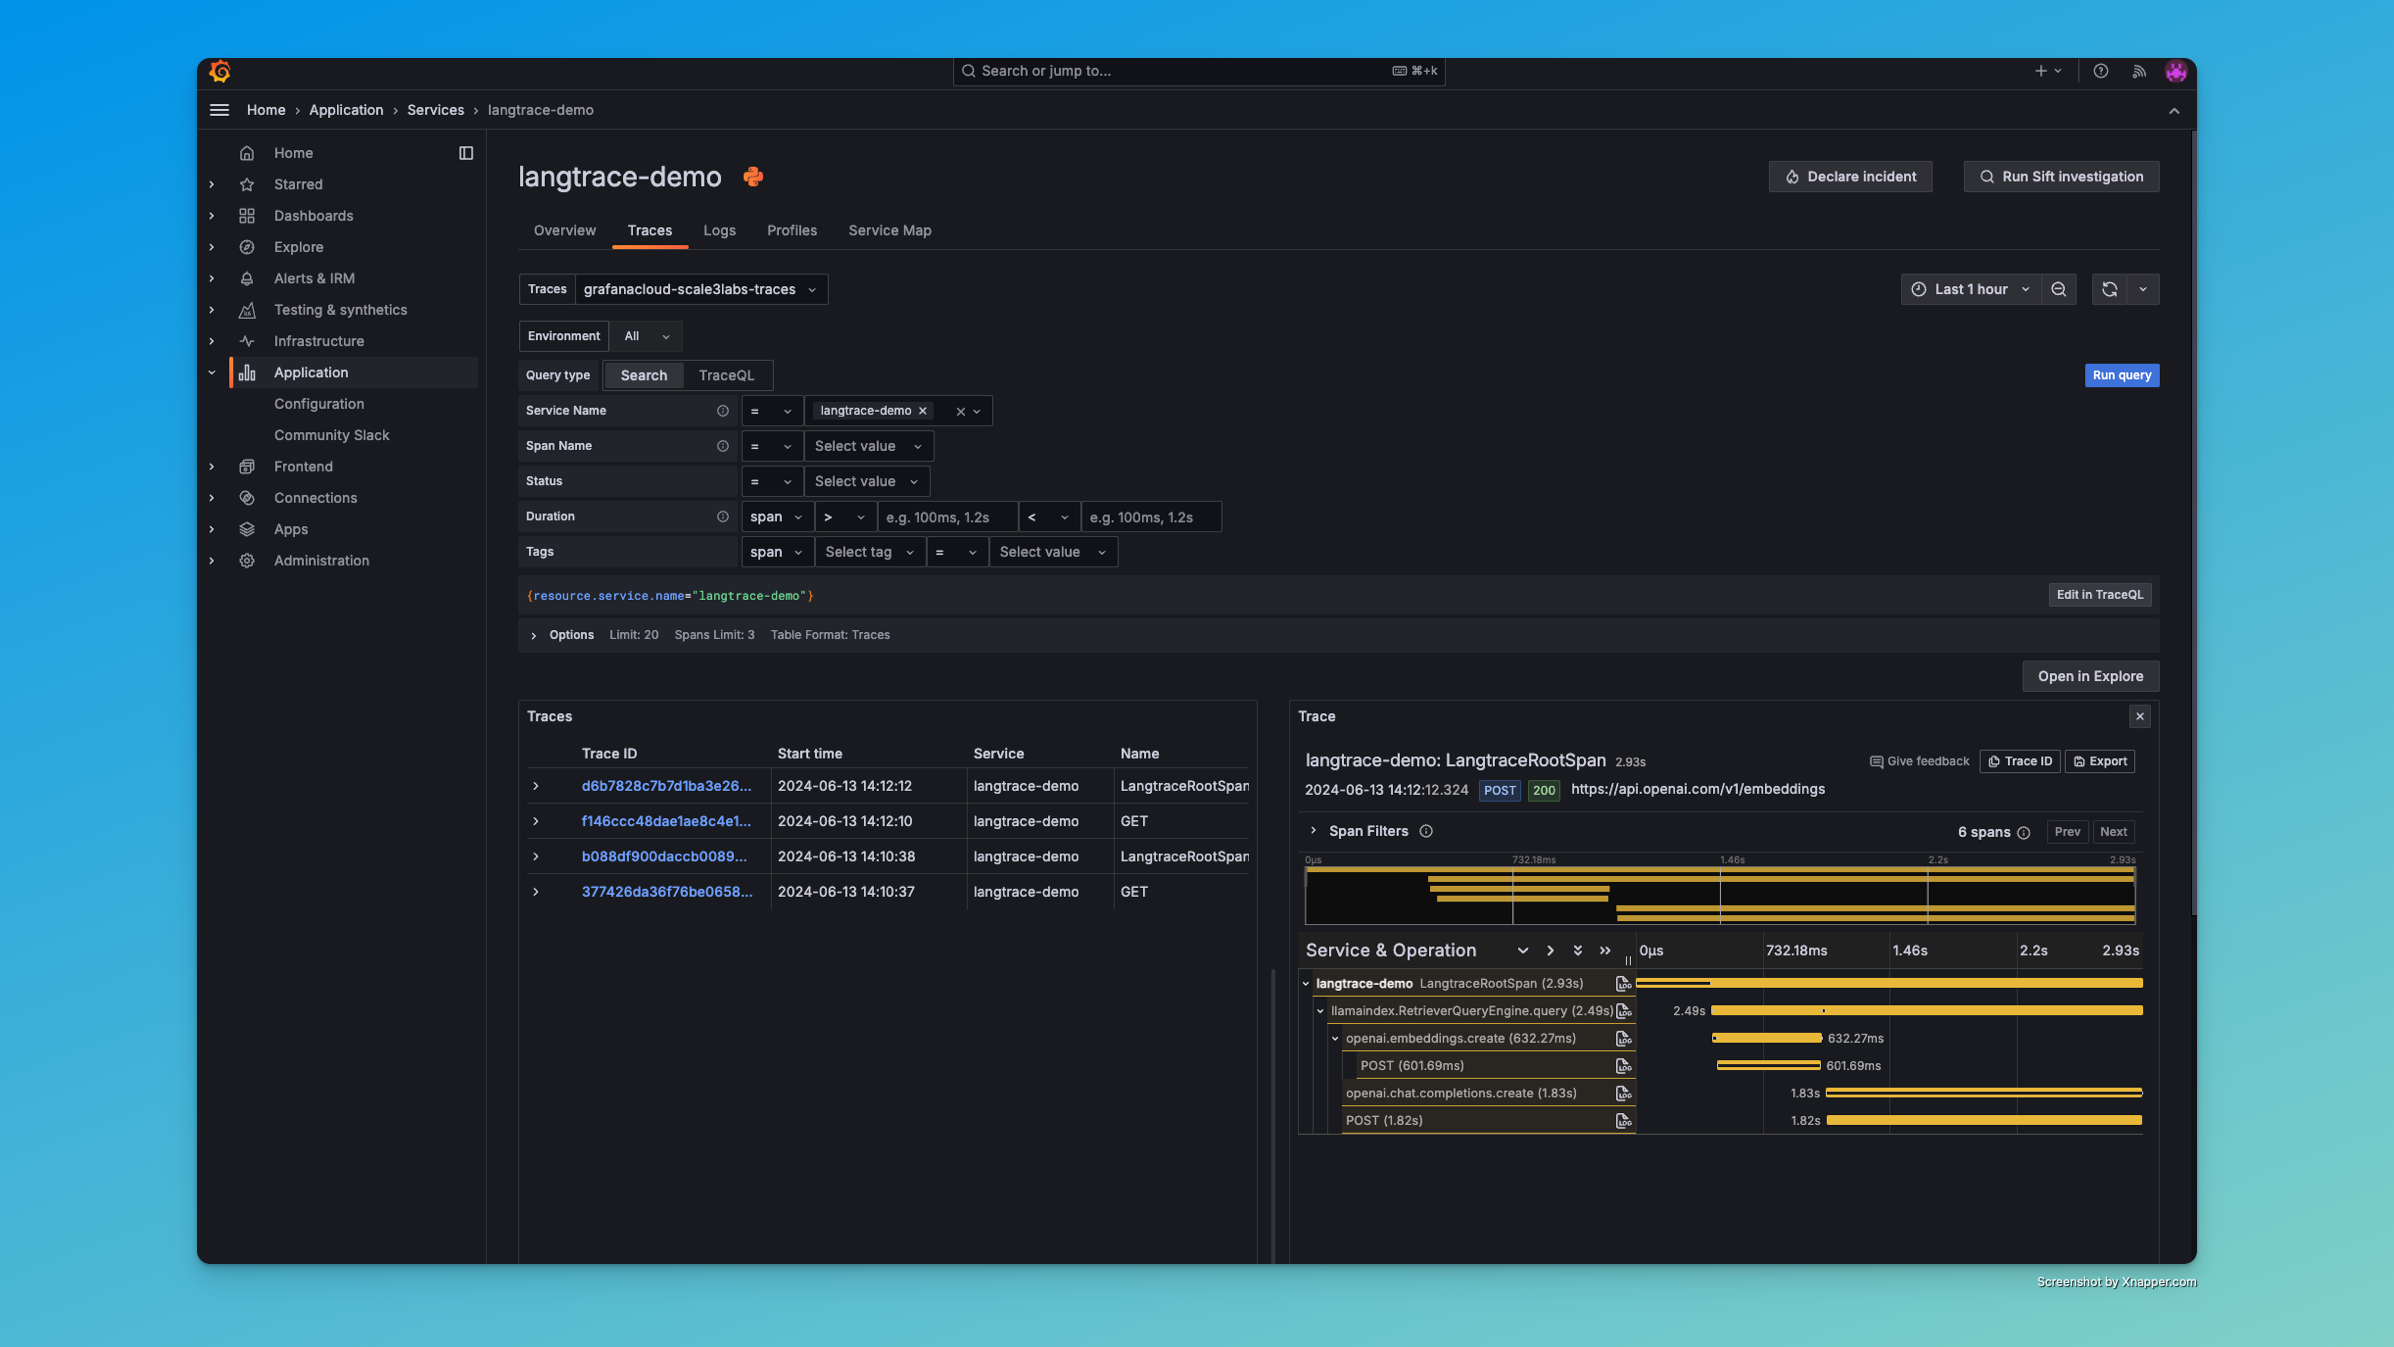
After running your Langtrace application, you should see traces generated in Grafana Tempo. You can now visualize and analyze the incoming requests and outgoing LLM calls made by your LLM application. Below is example of what you can expect to see in Grafana after integrating Langtrace:
 ### Troubleshooting
* **Traces not visible in Grafana**: Ensure that all required environment variables are set correctly. Double-check the variable names and values.
* **Missing Libraries**: Verify that all necessary libraries are installed. You can reinstall the required packages using the following commands:
```bash theme={null}
pip install opentelemetry-distro[otlp]
opentelemetry-bootstrap -a install
```
* **Formatting OTEL\_EXPORTER\_OTLP\_HEADERS**: Ensure that the space in the OTEL\_EXPORTER\_OTLP\_HEADERS value is replaced with %20. The correct format is:
```bash theme={null}
export OTEL_EXPORTER_OTLP_HEADERS="Authorization=Basic%20”
```
### Additional Resources
* [Grafana Application Observability Documentation](https://grafana.com/docs/grafana-cloud/monitor-applications/application-observability/setup/quickstart/)
* [Grafana Application Observability Python quickstart](https://grafana.com/docs/grafana-cloud/monitor-applications/application-observability/setup/quickstart/python/)
* [Langtrace AI Documentation](https://docs.langtrace.ai/)
* [Grafana Community](https://community.grafana.com/)
### Troubleshooting
* **Traces not visible in Grafana**: Ensure that all required environment variables are set correctly. Double-check the variable names and values.
* **Missing Libraries**: Verify that all necessary libraries are installed. You can reinstall the required packages using the following commands:
```bash theme={null}
pip install opentelemetry-distro[otlp]
opentelemetry-bootstrap -a install
```
* **Formatting OTEL\_EXPORTER\_OTLP\_HEADERS**: Ensure that the space in the OTEL\_EXPORTER\_OTLP\_HEADERS value is replaced with %20. The correct format is:
```bash theme={null}
export OTEL_EXPORTER_OTLP_HEADERS="Authorization=Basic%20”
```
### Additional Resources
* [Grafana Application Observability Documentation](https://grafana.com/docs/grafana-cloud/monitor-applications/application-observability/setup/quickstart/)
* [Grafana Application Observability Python quickstart](https://grafana.com/docs/grafana-cloud/monitor-applications/application-observability/setup/quickstart/python/)
* [Langtrace AI Documentation](https://docs.langtrace.ai/)
* [Grafana Community](https://community.grafana.com/)