> ## Documentation Index
> Fetch the complete documentation index at: https://docs.langtrace.ai/llms.txt
> Use this file to discover all available pages before exploring further.
# New Relic
> Langtrace and New Relic Integration Guide
## Overview
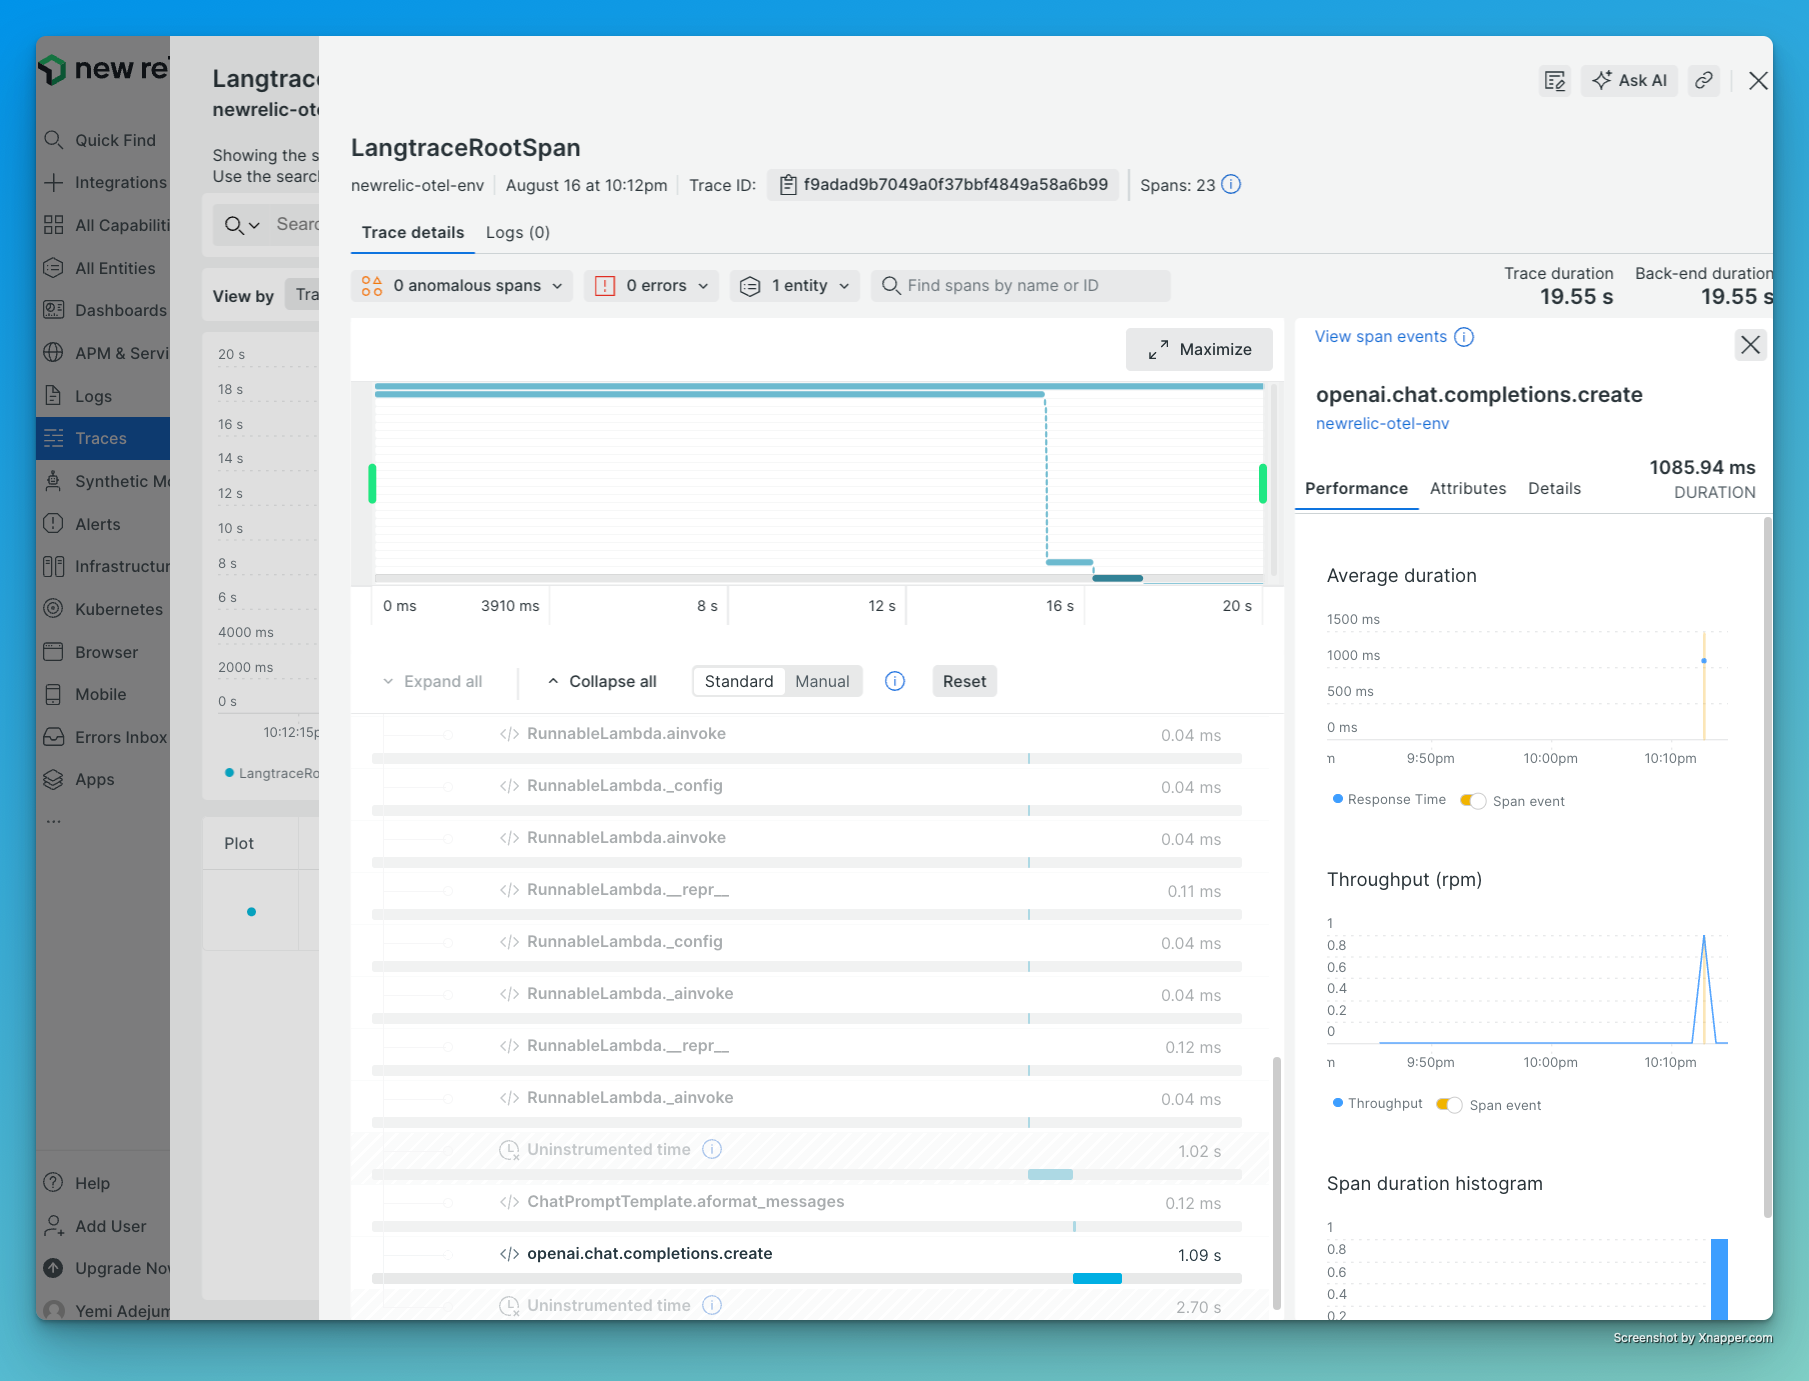
New Relic is a powerful observability platform for monitoring application performance. This guide focuses on integrating Langtrace AI with New Relic for distributed tracing. By leveraging New Relic's capabilities, you can analyze and visualize trace data from Langtrace AI.
 ## Setup
### Obtain New Relic API Key
To obtain your New Relic API key:
1. Log in to your [New Relic account](https://one.newrelic.com/)
2. Navigate to the API keys page in your account settings
3. Create a new API key or use an existing one with appropriate permissions When Creating a new API key, make sure to select th key type Ingest-Lisence
### Set Environment Variables
Set the following environment variables in your terminal or .env file:
```bash theme={null}
export OTEL_SERVICE_NAME=newrelic-otel-env
export OTEL_EXPORTER_OTLP_ENDPOINT=https://otlp.nr-data.net:443
export OTEL_EXPORTER_OTLP_HEADERS=api-key=your-new-relic-api-key
export OTEL_EXPORTER_OTLP_PROTOCOL=http/protobuf
```
For the `OTEL_EXPORTER_OTLP_PROTOCOL`, both `grpc` and `http` protocols are
supported. Choose the one that best fits your infrastructure setup.
## Additional Resources
* [New Relic OpenTelemetry Documentation](https://docs.newrelic.com/docs/more-integrations/open-source-telemetry-integrations/opentelemetry/introduction-opentelemetry-new-relic/)
* [Langtrace AI Documentation](https://docs.langtrace.ai/)
* [OpenTelemetry Python Documentation](https://opentelemetry.io/docs/instrumentation/python/)
## Setup
### Obtain New Relic API Key
To obtain your New Relic API key:
1. Log in to your [New Relic account](https://one.newrelic.com/)
2. Navigate to the API keys page in your account settings
3. Create a new API key or use an existing one with appropriate permissions When Creating a new API key, make sure to select th key type Ingest-Lisence
### Set Environment Variables
Set the following environment variables in your terminal or .env file:
```bash theme={null}
export OTEL_SERVICE_NAME=newrelic-otel-env
export OTEL_EXPORTER_OTLP_ENDPOINT=https://otlp.nr-data.net:443
export OTEL_EXPORTER_OTLP_HEADERS=api-key=your-new-relic-api-key
export OTEL_EXPORTER_OTLP_PROTOCOL=http/protobuf
```
For the `OTEL_EXPORTER_OTLP_PROTOCOL`, both `grpc` and `http` protocols are
supported. Choose the one that best fits your infrastructure setup.
## Additional Resources
* [New Relic OpenTelemetry Documentation](https://docs.newrelic.com/docs/more-integrations/open-source-telemetry-integrations/opentelemetry/introduction-opentelemetry-new-relic/)
* [Langtrace AI Documentation](https://docs.langtrace.ai/)
* [OpenTelemetry Python Documentation](https://opentelemetry.io/docs/instrumentation/python/)