Setup
- Follow the DSPy installation guide to install DSPy.
- Install Langtrace’s SDK and initialize the SDK in your code.
- Create a project on Langtrace with type
DSPy. - Run your DSPy pipeline or agent and view the traces in Langtrace.
- To run experiments, follow the conventions below and head over to the
Experimentstab in Langtrace to view your experiments.
Important: Follow the steps below for running experiments
inject_additional_attributes.
This way Langtrace knows that you are running an experiment:
- (Required)
experiment- Experiment name. Ex:experiment 1. - (Optional)
description- Some useful description about the experiment. - (Optional)
run_id- When you want to associate traces to a specific runs, pass a unique run ID. This is useful when you are runningEvaluate()as part of your experiment where the traces specific to theEvaluate()will appear as an individual entry.
Evaluate(). Note: Currently the score ranges it supports are between 0 and 100. So if you have scores that do not fall within this range, it could cause some UI issues.
Checkpoints
By default, checkpoints are traced for DSPy pipelines. If you would like to disable it, set the following env var,TRACE_DSPY_CHECKPOINT=false
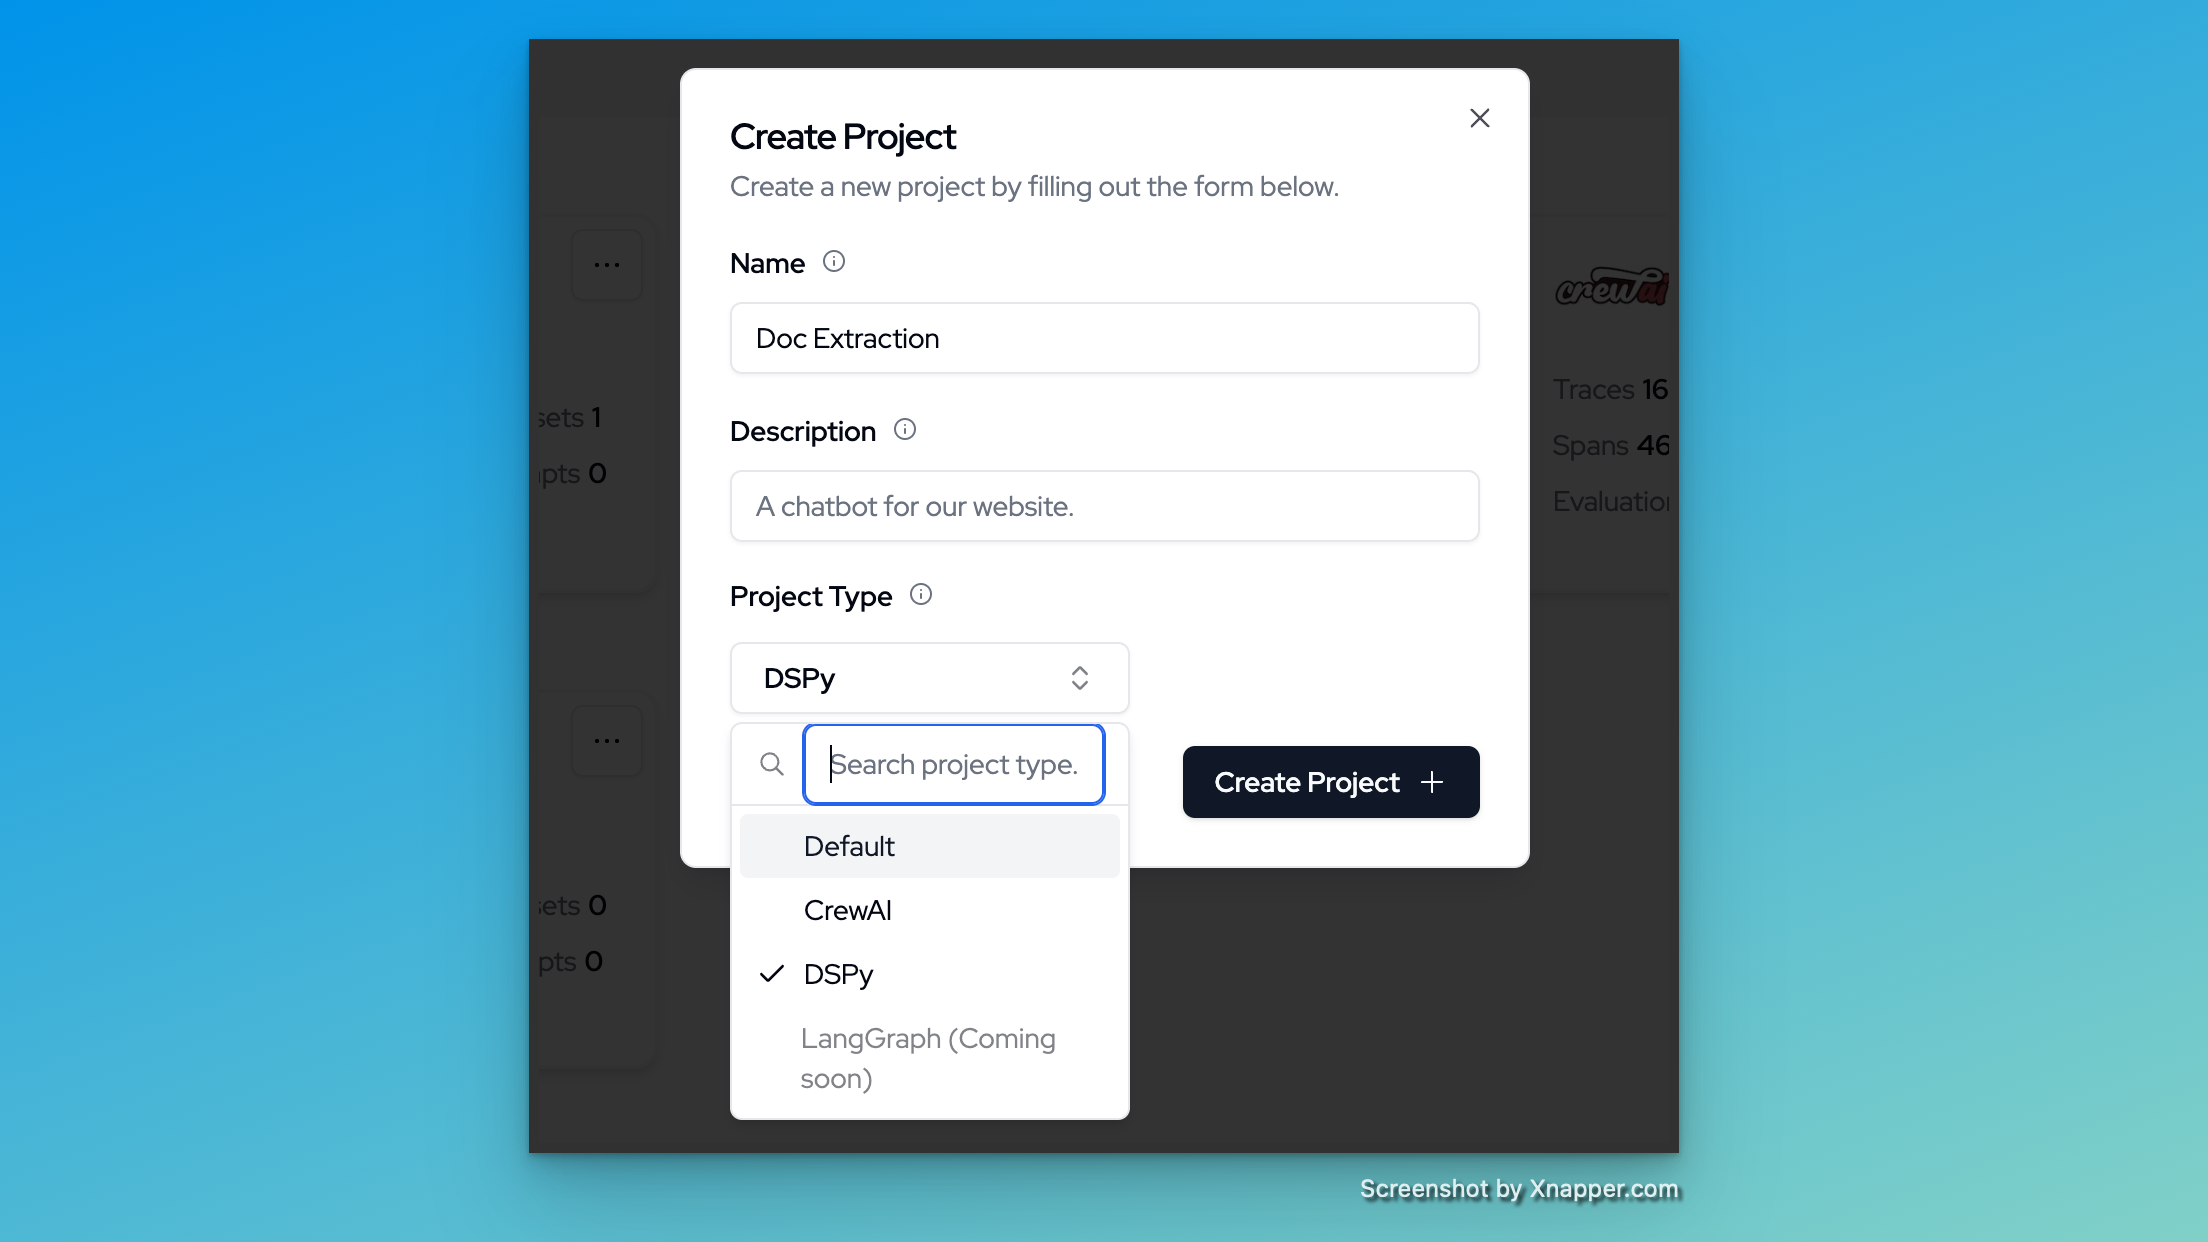
Project Type
When creating a project in Langtrace, select the project type asDSPy.
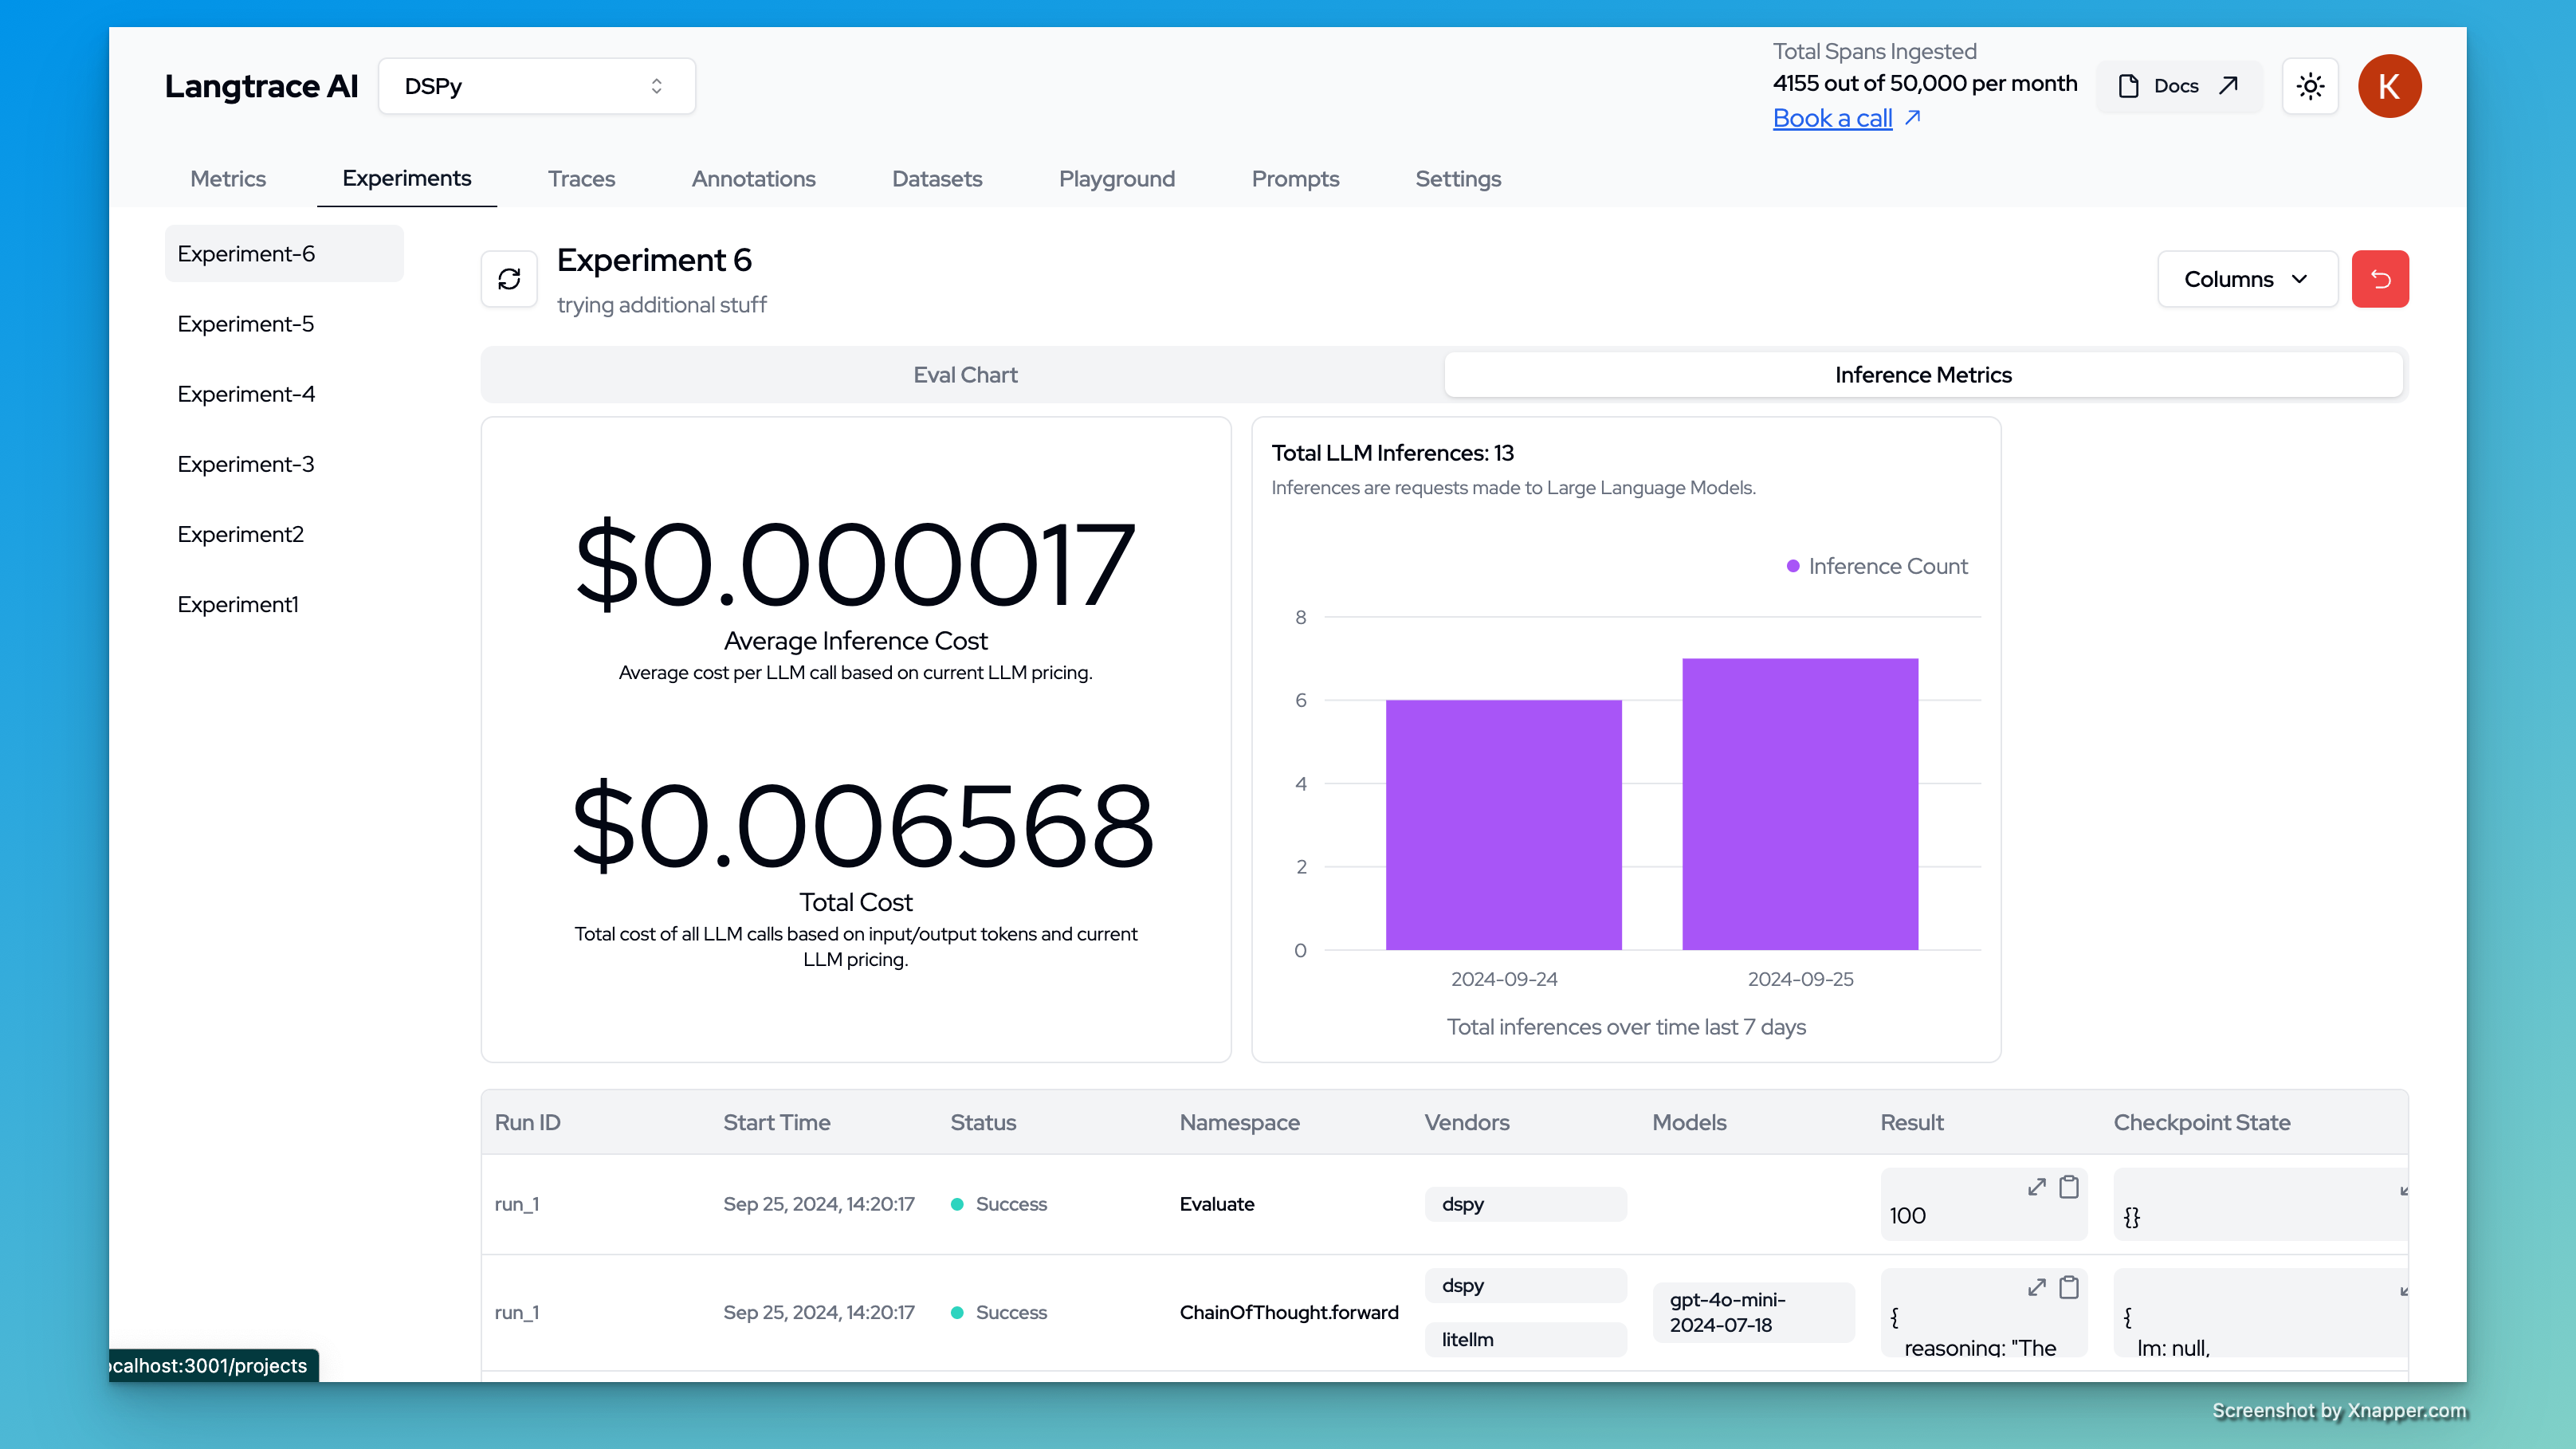
Inference Metrics
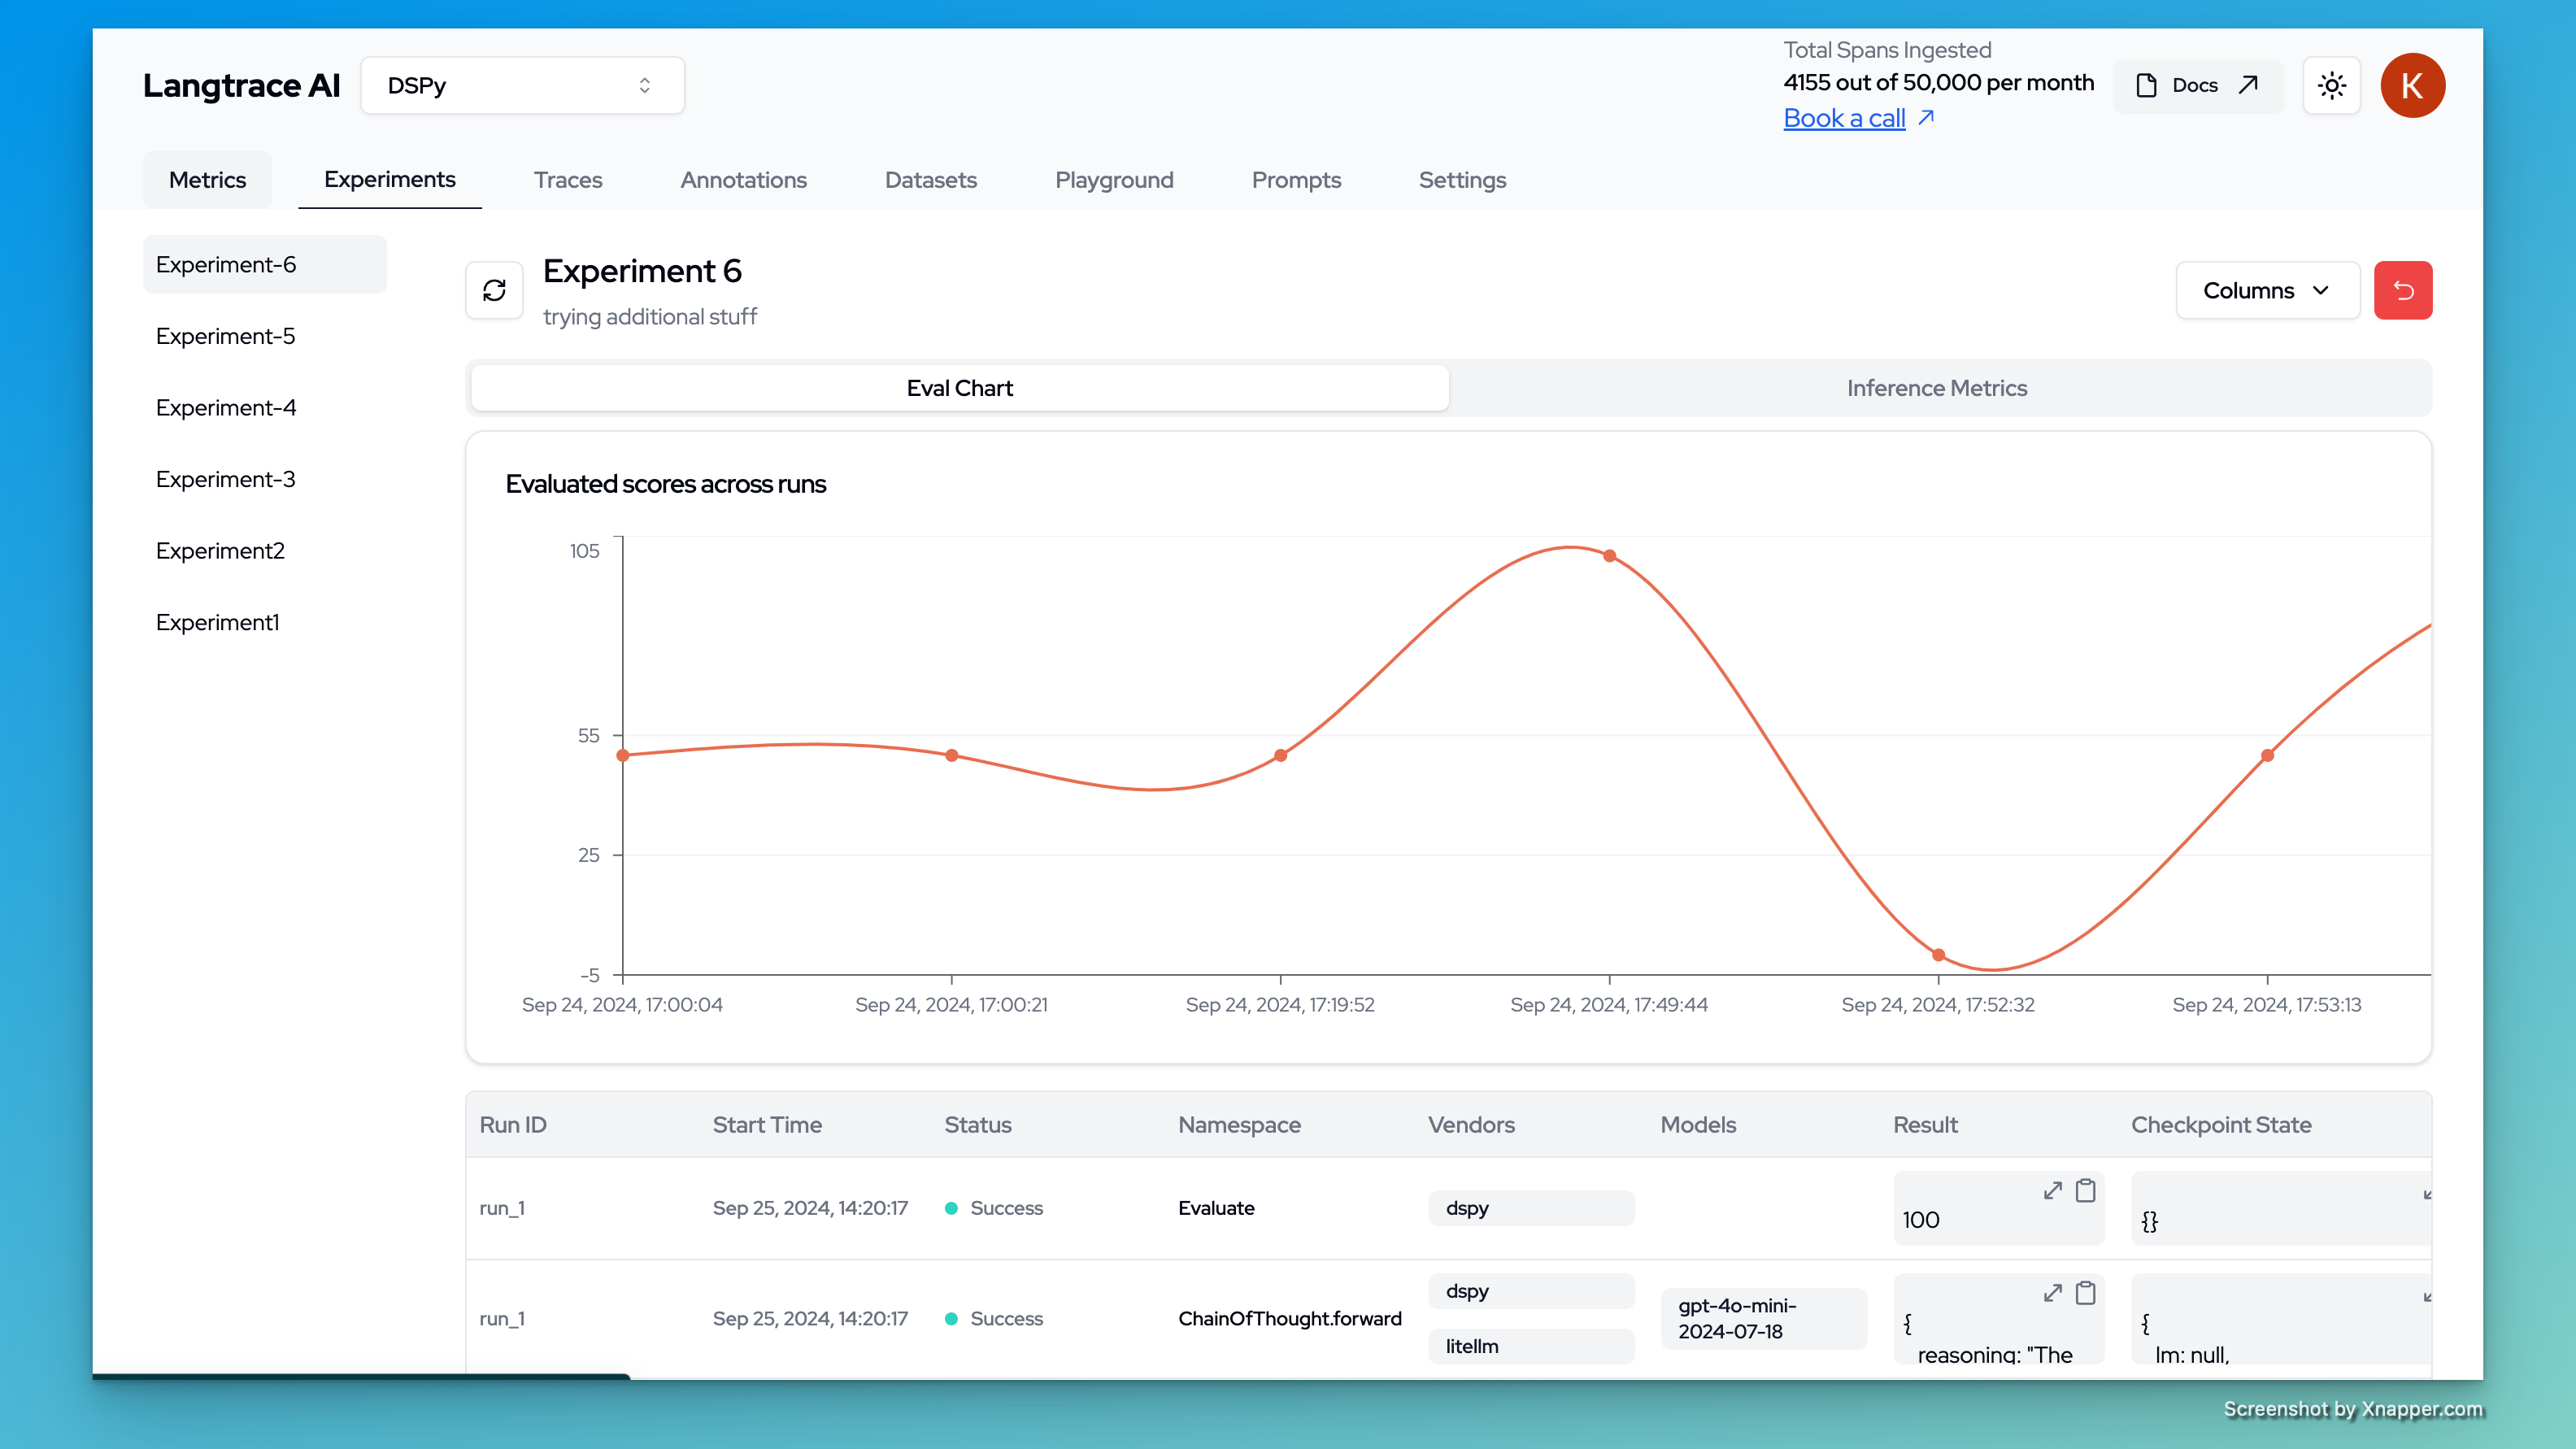
Evaluation Scores
Troubleshooting
Missing LLM Calls in Traces
If you’re not seeing LLM calls in your Langtrace traces when using DSPy, consider the following:DSPy Caching
DSPy Caching
DSPy implements caching of LLM calls by default. This means that repeated identical calls to the language model will not trigger new API requests, and consequently, won’t generate new traces in Langtrace.To ensure you’re seeing all LLM calls:
- Disable caching: If you need to trace every call for debugging purposes, you can disable DSPy’s caching mechanism. Refer to the DSPy documentation for instructions on how to disable caching.
- Vary your inputs: If you’re testing, make sure to use different inputs for each run to avoid hitting the cache.
- Clear the cache: If you need to re-run the same inputs, consider clearing DSPy’s cache between runs.
- Check your DSPy configuration: Ensure that your DSPy setup is correctly configured to use the LLM provider you expect.
Grouping of Spans in Trace when using ThreadpoolExecutor in DSPy
If you’re using ThreadpoolExecutor in DSPy to parallelize your modules, you may notice that the spans in the trace are not grouped together. This is because the spans are created in the same thread and are not propagated to the parent span. To resolve this issue,Span Grouping for ThreadpoolExecutor
Span Grouping for ThreadpoolExecutor
Please use the provided code snippet as an example to ensure that the current tracing context is properly propagated when executing tasks within a
ThreadPoolExecutor. The contextvars module is used to copy the current context and run the optimized CoT module within the copied context. By passing contextvars.copy_context().run to the executor.submit method, the current tracing context is propagated to the child span ensuring that the spans are grouped together in the trace.