Overview

Elastic APM is a powerful solution for monitoring the performance of your applications. As Elastic APM is OpenTelemetry (OTel) compatible by default, you can easily integrate it with Langtrace to monitor your LLM applications.
Environment Variables

Set up the following environment variables to enable OpenTelemetry tracing and send traces to Elastic APM:

export OTEL_EXPORTER_OTLP_ENDPOINT="abcd1234.apm.us-central1.gcp.cloud.es.io:443"  # Your Elastic OTEL endpoint
export OTEL_EXPORTER_OTLP_HEADERS="Authorization=Bearer <secret>"
export OTEL_RESOURCE_ATTRIBUTES="service.name=rag-app-demo,service.version=0.0.1,deployment.environment=production"

We support all OpenTelemetry environment variables. You can also use the legacy format:

export LANGTRACE_API_HOST="<https://your-elastic-apm-endpoint:443/v1/traces>"
export LANGTRACE_HEADERS="Authorization=Bearer your-elastic-apm-token"
export OTEL_SERVICE_NAME=your-elastic-service

RAG Application Example

Here’s an example of monitoring a Retrieval-Augmented Generation (RAG) chatbot application that uses Elastic Search for document search and Azure OpenAI for generating responses.

Initialize Langtrace

from langtrace_python_sdk import langtrace
langtrace.init()

# Rest of your application code

Configure Azure OpenAI (if using)

Set up the necessary Azure OpenAI environment variables:

export LLM_TYPE=azure
export OPENAI_VERSION=<version>       # e.g., 2023-05-15
export OPENAI_BASE_URL=<base_url>     # Azure OpenAI endpoint URL
export OPENAI_API_KEY=<api_key>       # Azure OpenAI API key
export OPENAI_ENGINE=<deployment_name> # Azure deployment name

Monitoring in Elastic APM

After setting up your application, you can monitor your RAG application’s performance in the Elastic APM dashboard. The interface provides deep insights into your application’s behavior:

The main dashboard displays:

  • Service health metrics
  • Transaction throughput
  • Error rates and patterns
  • Infrastructure metrics

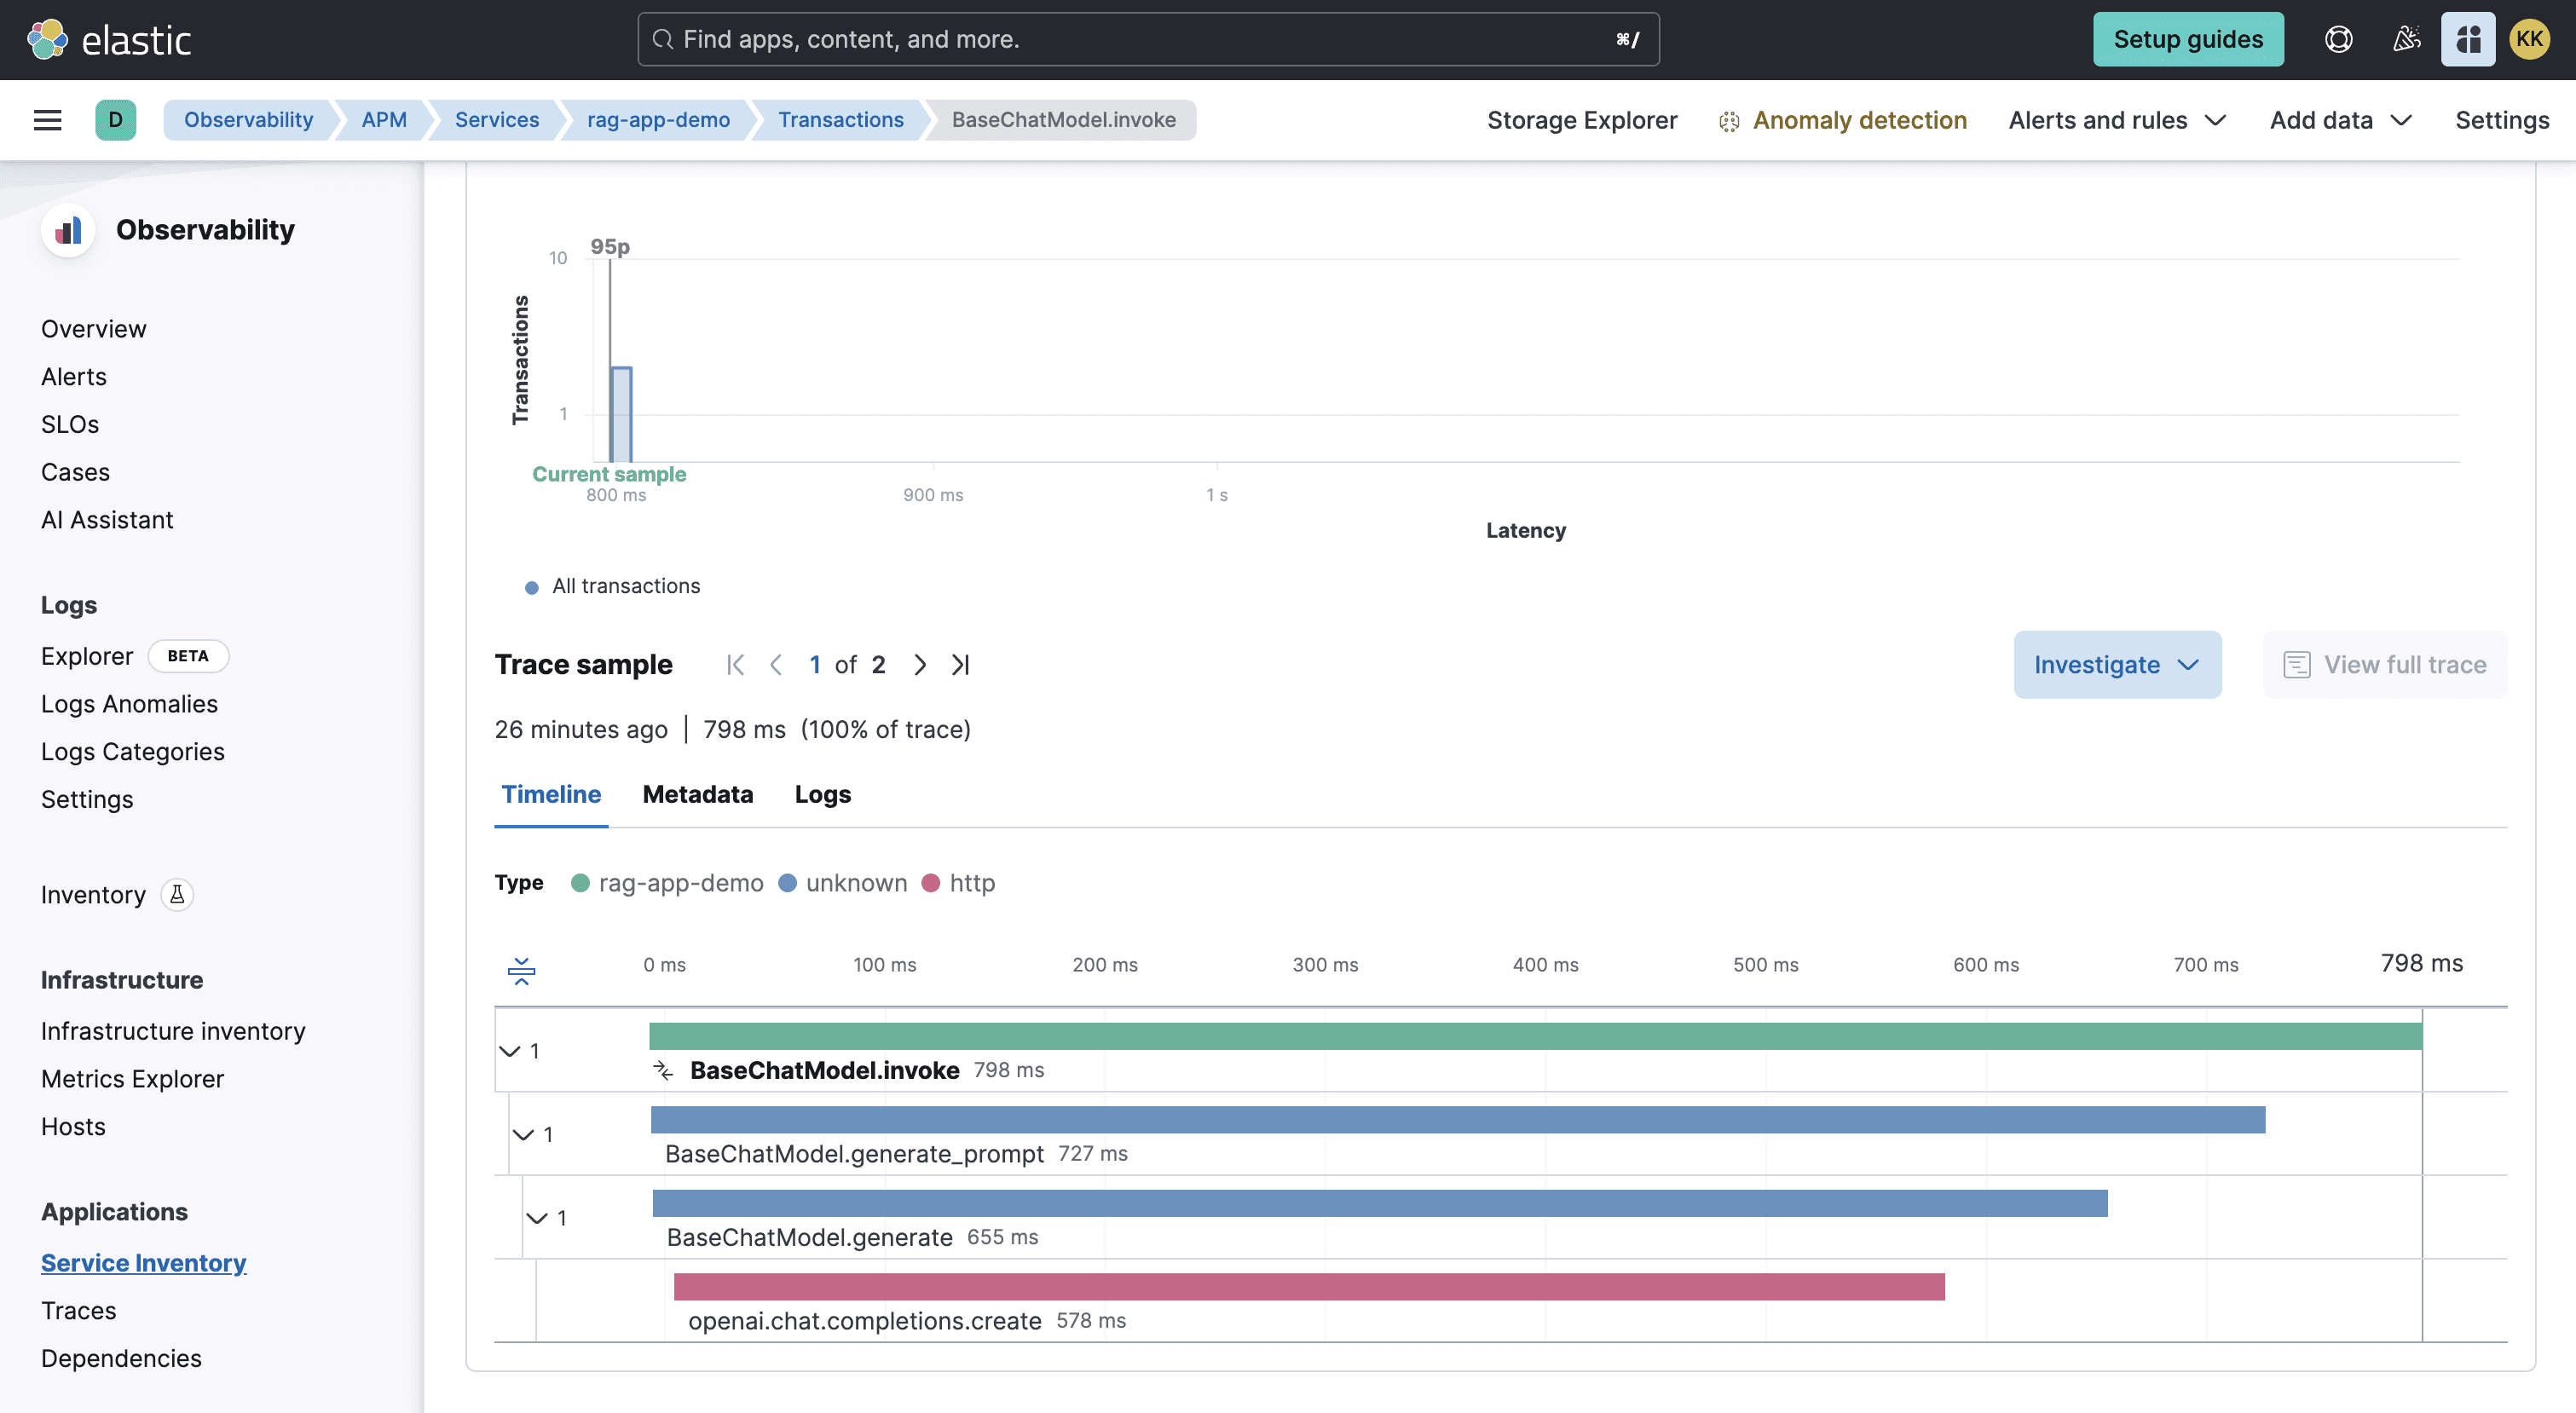
Detailed trace analysis reveals the complete request journey:

The trace view enables you to:

  • Track request flows
  • Measure operation durations
  • Identify performance bottlenecks
  • Monitor error propagation

For detailed span inspection:

The span analysis shows:

  • Precise timing measurements
  • Request/response payloads
  • Error context and details
  • Custom metadata and annotations

Use these traces for:

  • Debugging issues
  • Performance monitoring
  • System optimization
  • Understanding user interactions

Troubleshooting

Traces not visible in Elastic APM:

  • Ensure that all required environment variables are set correctly
  • Verify your OTEL_EXPORTER_OTLP_ENDPOINT or LANGTRACE_API_HOST includes /v1/traces at the end
  • Check if your authentication token is valid and properly formatted
  • Verify your service name is correctly set in OTEL_RESOURCE_ATTRIBUTES

Missing spans or incomplete traces:

  • Ensure Langtrace is initialized before any LLM operations
  • Check if all required dependencies are installed
  • Verify your application has proper permissions to send traces

Additional Resources