New Relic
Langtrace and New Relic Integration Guide
Overview
New Relic is a powerful observability platform for monitoring application performance. This guide focuses on integrating Langtrace AI with New Relic for distributed tracing. By leveraging New Relic’s capabilities, you can analyze and visualize trace data from Langtrace AI.
Prerequisites
Before you begin, ensure you have the following:
- A New Relic account
- A Langtrace AI account
Setup
Obtain New Relic API Key
To obtain your New Relic API key:
- Log in to your New Relic account
- Navigate to the API keys page in your account settings
- Create a new API key or use an existing one with appropriate permissions
Set Environment Variables
Set the following environment variables in your terminal or .env file:
Replace your-new-relic-api-key
with your actual New Relic API key.
Install the Instrumentation Library
Install the necessary packages:
Add the custom exporter to your code
Add the following code snippet to your Python application:
Initialize the Langtrace SDK
Initialize the Langtrace SDK in your application:
Run the Application
With the environment variables set, run your application:
Verifying the Setup
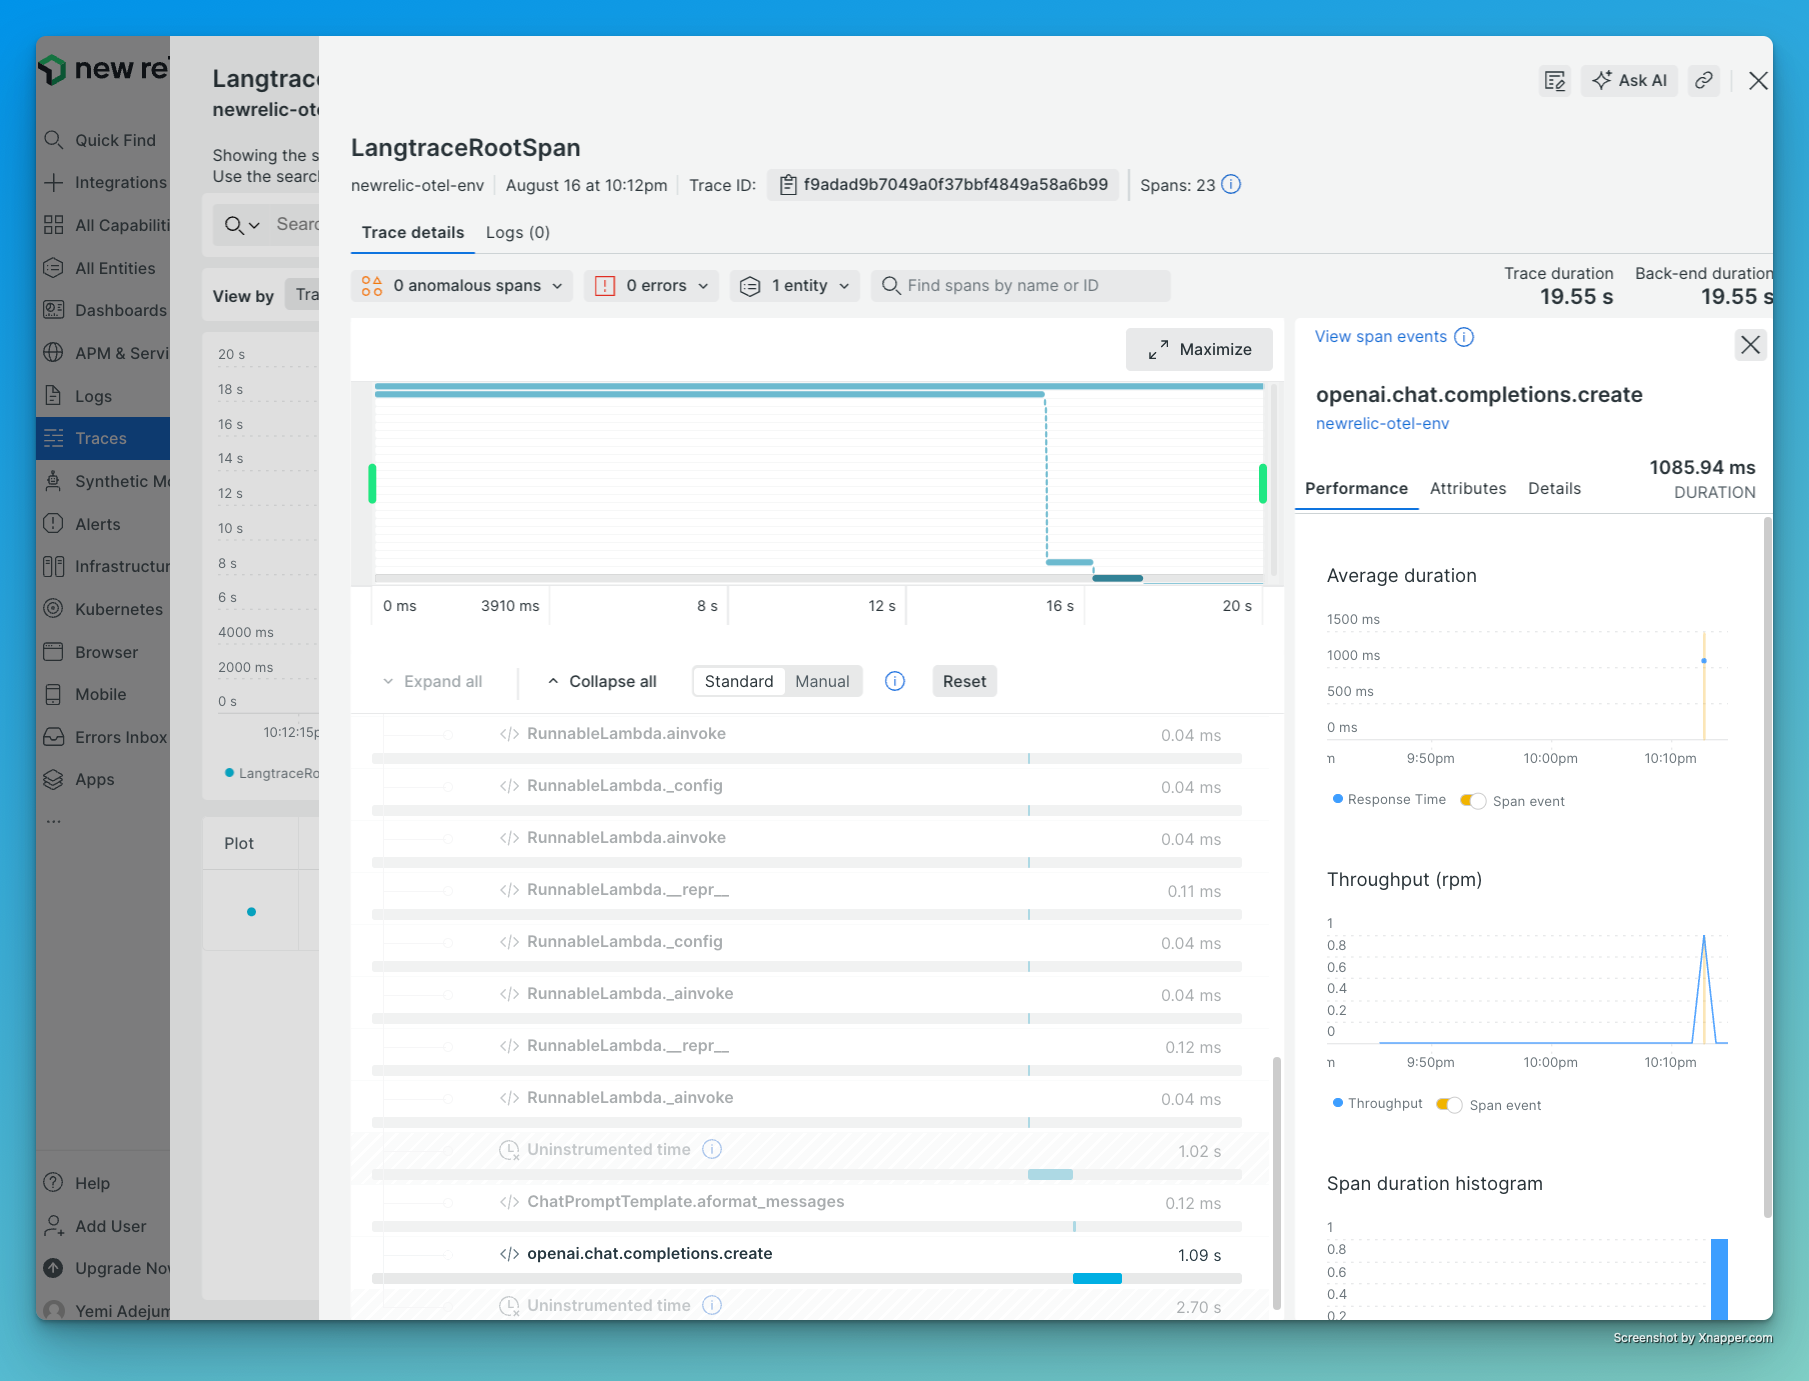
Once the application is running, you should see traces appearing in your New Relic dashboard. Look for the service name you specified in the OTEL_SERVICE_NAME
environment variable.
Example Application
Here’s a simple example of a Python application using Langtrace AI and New Relic. Check out our Langtrace Recipes repository for more examples:
Troubleshooting
-
Traces not visible in New Relic:
- Ensure all required environment variables are set correctly.
- Verify that your New Relic API key is valid and has the necessary permissions.
- Check that the
OTEL_EXPORTER_OTLP_ENDPOINT
is correct for your New Relic account region.
-
Connection Issues:
- Ensure your network allows outbound connections to the New Relic endpoint.
- Verify that the Content-Type header is set to “application/json” in the exporter configuration.