SigNoz is an open-source observability platform that helps developers monitor their applications and troubleshoot issues. It provides a rich set of features for monitoring and analyzing traces, metrics, and logs.
Setup

  1. Install langtrace’s SDK and initialize the SDK in your code.
  2. Sign up and start visualizing the traces on SigNoz

Environment Variables

Set up the following environment variables to enable OpenTelemetry tracing and send traces to SigNoz:

OTEL_EXPORTER_OTLP_ENDPOINT="ingest.us.signoz.cloud:443"
OTEL_EXPORTER_OTLP_HEADERS="signoz-access-token=<token>"
OTEL_RESOURCE_ATTRIBUTES=service.name="rag chatbot"
OTEL_EXPORTER_OTLP_PROTOCOL="grpc"

Replace <token> with your SigNoz access token.

RAG Application Example

Here’s an example of monitoring a Retrieval-Augmented Generation (RAG) chatbot application that uses Elastic Search for document search and Azure OpenAI for generating responses.

Initialize Langtrace

from langtrace_python_sdk import langtrace
langtrace.init()

Configure Azure OpenAI (if using)

Set up the necessary Azure OpenAI environment variables:

export LLM_TYPE=azure
export OPENAI_VERSION=<version>       # e.g., 2023-05-15
export OPENAI_BASE_URL=<base_url>     # Azure OpenAI endpoint URL
export OPENAI_API_KEY=<api_key>       # Azure OpenAI API key
export OPENAI_ENGINE=<deployment_name> # Azure deployment name

Running Your Application

For a Flask application, use the OpenTelemetry instrumentation:

OTEL_RESOURCE_ATTRIBUTES=service.name=Langtrace \
OTEL_EXPORTER_OTLP_ENDPOINT="<SIGNOZE_OTLP_ENDPOINT>" \
OTEL_EXPORTER_OTLP_HEADERS="<SIGNOZ_OTLP_HEADER>" \
OTEL_EXPORTER_OTLP_PROTOCOL=grpc \
opentelemetry-instrument uvicorn main:app

Monitoring in SigNoz

After setting up your application, you can monitor your RAG application’s performance in the SigNoz dashboard. The dashboard provides comprehensive visibility into your application’s behavior:

The main dashboard shows key metrics including:

  • Request rates and latency
  • Error rates and distribution
  • Resource utilization patterns
  • Service dependencies

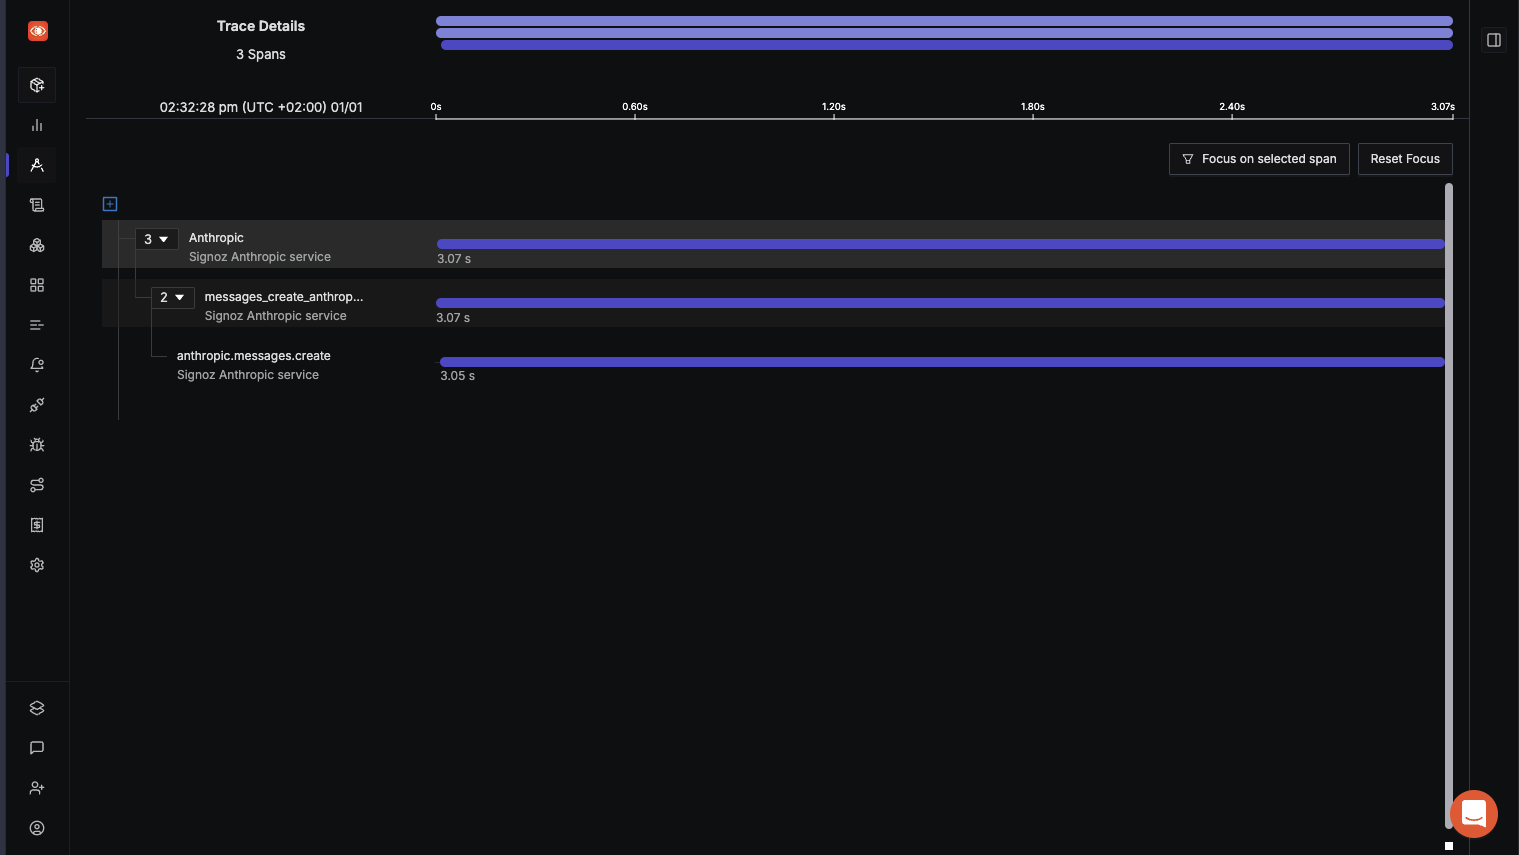
Diving deeper into specific traces reveals detailed execution flows:

The trace view helps you:

  • Track request propagation
  • Identify bottlenecks
  • Measure component-wise latency
  • Debug error scenarios

For granular analysis, you can examine individual spans:

The span view provides:

  • Detailed timing information
  • Input/output parameters
  • Error messages and stack traces
  • Custom attributes and tags

Use these traces for:

  • Debugging issues
  • Performance monitoring
  • System optimization
  • Understanding user interactions

Troubleshooting

  • No traces visible: Verify your SigNoz endpoint and token are correct
  • Missing spans: Ensure Langtrace is properly initialized before any LLM operations
  • Connection issues: Check if your OTLP endpoint is accessible from your application

That’s it! ✨ 🧙‍♂️ Enjoy the high cardinality traces on SigNoz.